
 These six quadruply-lensed quasars, all imaged by the Hubble Space Telescope, exhibit time delays due to the different lengths of the light-paths for each of the multiple images. Mapping out the foreground mass of the lensing object plus measuring the time delay of the light-path allows us to measure the expansion rate of the Universe: a measurement that will only improve as we collect more of these systems.
Credit: NASA, ESA, A. Nierenberg (JPL) and T. Treu (UCLA)
Key Takeaways
These six quadruply-lensed quasars, all imaged by the Hubble Space Telescope, exhibit time delays due to the different lengths of the light-paths for each of the multiple images. Mapping out the foreground mass of the lensing object plus measuring the time delay of the light-path allows us to measure the expansion rate of the Universe: a measurement that will only improve as we collect more of these systems.
Credit: NASA, ESA, A. Nierenberg (JPL) and T. Treu (UCLA)
Key Takeaways
- The Hubble tension is one of the biggest puzzles in modern cosmology, with the “early relic” method yielding values of 67 km/s/Mpc and the “distance ladder” method returning 73 km/s/Mpc for the expansion rate.
- Everyone agrees that the Universe is expanding, that dark energy is present and dominant, and that our Universe is only 5% normal matter and radiation. But the rate of cosmic expansion remains a huge source of tension.
- For a long time, people have proposed independent, “third way” methods of measuring the cosmic expansion to see who is right and who is wrong. But this isn’t a 2-against-1 case; it’s a far deeper mystery.
When it comes to the question of the expanding Universe, all observations agree that yes, the Universe is indeed expanding, in agreement with Edwin Hubble’s earliest observations dating all the way back to the 1920s. However, the question of “how fast” the Universe is expanding is one that’s long been controversial, and remains so even today. In fact, there are two main classes of measurement one can make to determine the cosmic expansion rate, and they yield different, incompatible values.
- You can start with a primordial signature imprinted early on in the hot Big Bang, like the acoustic scale, and evolve it forward in time to explain what you observe today. This “early relic” method yields values for today’s expansion rate of 67 km/s/Mpc.
- Or you can start in the here-and-now and look back to a distant set of signal sources, like stars, supernovae, quasars, etc. This “distance ladder” method yields a different set of values for today’s expansion rate of 73 km/s/Mpc.
This difference is known as the Hubble tension, and is one of the biggest puzzles facing modern cosmology here in the 2020s. Many different teams are seeking a third, independent method to measure the expansion rate, putting forth ideas like:
- using gravitationally lensed supernovae,
- using gravitationally lensed quasars,
- or using the “standard siren” of merging neutron stars,
seeking to determine which camp is ultimately correct. But that’s the wrong way to think about the problem, as none of these are capable of resolving the Hubble tension at all. Here’s what’s going on, and why even though gravitational lensing is amazing, it won’t solve the Hubble tension.
 The ‘raisin bread’ model of the expanding Universe, where relative distances increase as the space (dough) expands. The farther away any two raisins are from one another, the greater the observed redshift will be by the time the light is received. The redshift-distance relation predicted by the expanding Universe is borne out in observations, but different methods of measuring the cosmic expansion yield different, incompatible results.
Credit: Ben Gibson/Big Think; Adobe Stock
The ‘raisin bread’ model of the expanding Universe, where relative distances increase as the space (dough) expands. The farther away any two raisins are from one another, the greater the observed redshift will be by the time the light is received. The redshift-distance relation predicted by the expanding Universe is borne out in observations, but different methods of measuring the cosmic expansion yield different, incompatible results.
Credit: Ben Gibson/Big Think; Adobe Stock
If you try and imagine the expanding Universe, you might picture something like the illustration above: of a ball of dough that’s loaded with raisins. In this illustration, the raisins represent gravitationally bound structures — structures like stellar systems, galaxies, or even large groups or clusters of galaxies — while the dough represents the fabric of space. The raisins can emit or absorb light, and can also bend and distort the curvature of space around them, while the dough is completely transparent and not directly detectable to our instruments. However, by tracking the motions (and other properties) of the raisins, we can draw inferences about how the dough (i.e., the fabric of the Universe) is expanding over time.
But how can you determine how fast the Universe is expanding?
- You can start nearby, and begin looking farther and farther back in both distance and time: this will allow you to determine how the Universe has expanded over the time from your most distant/earliest object until the present. (That’s why it’s the distance ladder method: because we build out to greater distances and earlier times rung-by-rung.)
- You can start early on in the hot Big Bang, and calculate something that’s imprinted onto the Universe early on (like the acoustic scale, or the “bounce” feature that shows up in galaxy clustering and/or the CMB’s temperature fluctuations), and then measure how that feature appears to us today. This tells you how the Universe expanded from the generation of that feature until you make your observations. (That’s why it’s the early relic method: because it starts with an early relic and observes how that relic evolves from then until now.)
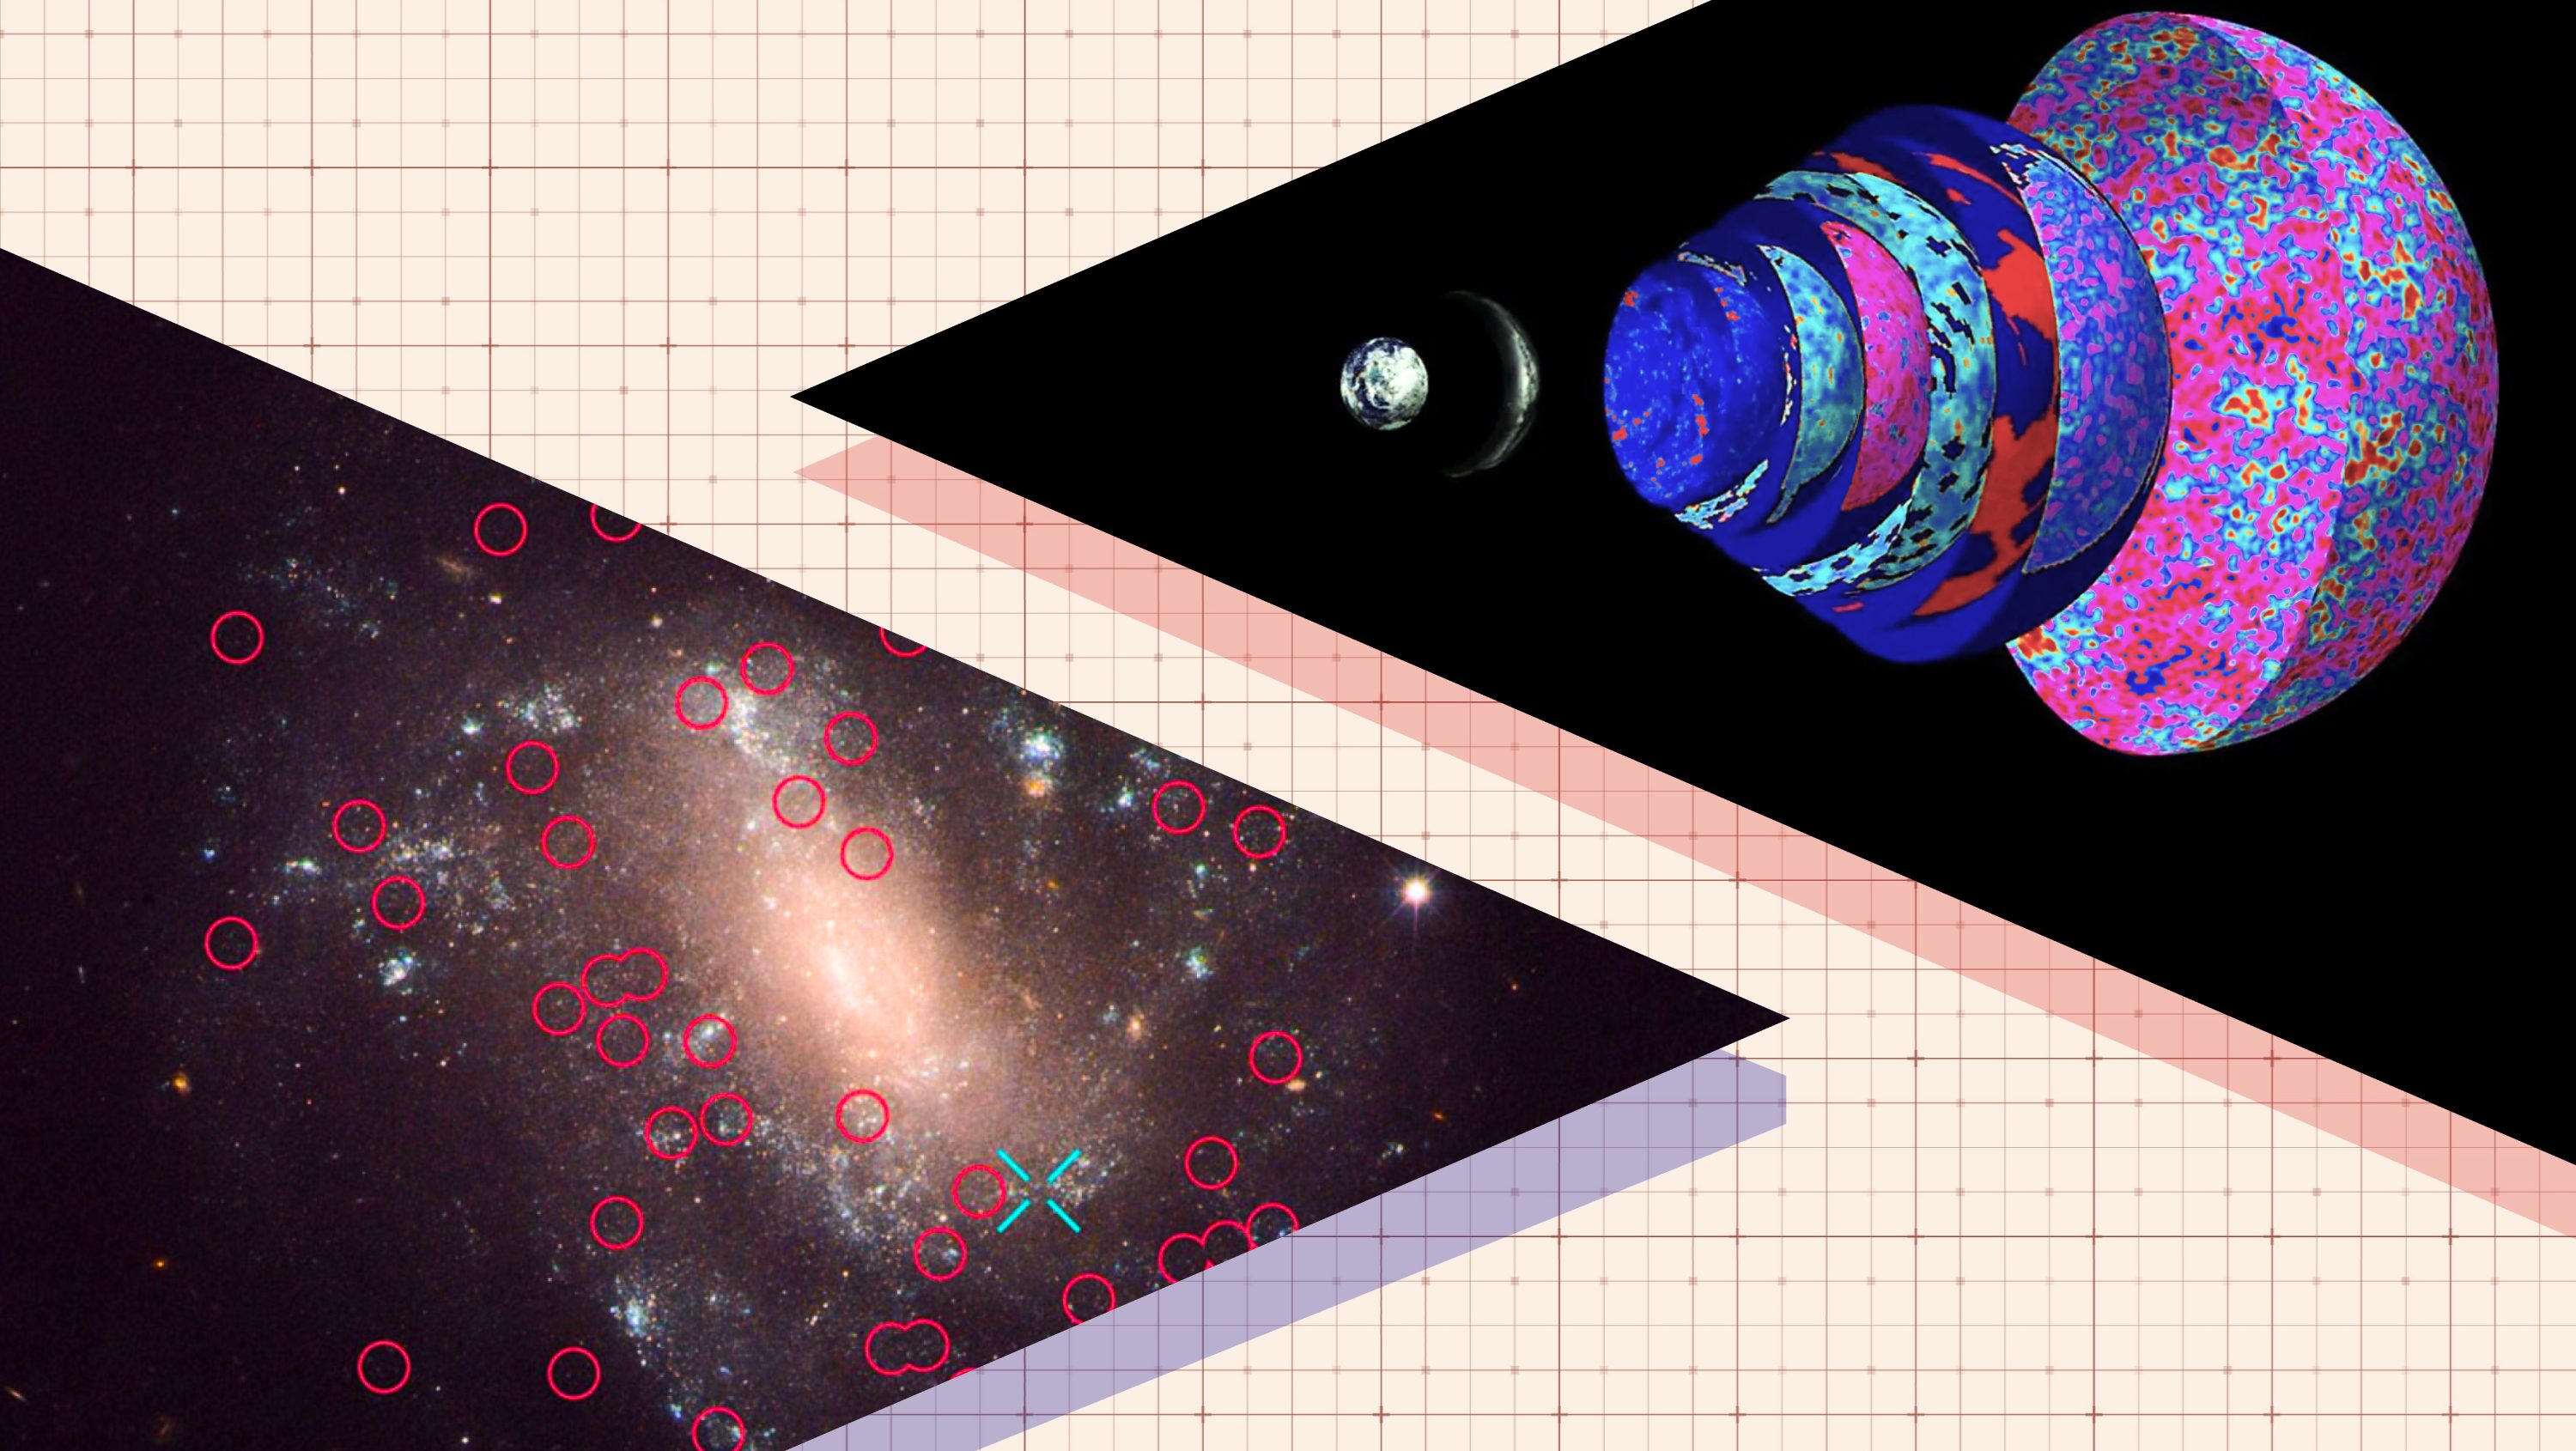 If you measure the expansion rate of the Universe using an early relic method, like the light from the CMB (top right), you get a value of around 67 km/s/Mpc. If you measure it by constructing a distance ladder (below left), such as with Cepheids and type Ia supernovae, you get a value more like 73 km/s/Mpc. This discrepancy is at the root of the Hubble tension.
Credit: Annelisa Leinbach / NASA, Adobe Stock
If you measure the expansion rate of the Universe using an early relic method, like the light from the CMB (top right), you get a value of around 67 km/s/Mpc. If you measure it by constructing a distance ladder (below left), such as with Cepheids and type Ia supernovae, you get a value more like 73 km/s/Mpc. This discrepancy is at the root of the Hubble tension.
Credit: Annelisa Leinbach / NASA, Adobe Stock
The fact that these two general classes of methods — the distance ladder method and the early relic method — all give consistent answers (so long as you use the same class of method) is, on the one hand, extremely heartening. We should be able to use any indicator or observable that’s compatible with the method in question, and if things are consistent and repeatable, that bolsters the case that our conclusions are reliable. “Independent, repeatable confirmation” is what we always look for in science, so if we can use a variety of types of measurements that all reach the same conclusion using the same general method, that strengthens our scientific case for believing our results.
We can do this with both the distance ladder method (using various types of stars, various galactic properties, and/or various stellar cataclysms), and also with the early relic method (using the fluctuations in the CMB and using the baryon acoustic oscillation feature that appears in large-scale structure), and again the results are consistent. The early relic method always yields values of 67 km/s/Mpc, with an uncertainty of under 1%, and the distance ladder method always yields values of 73 km/s/Mpc, with the most precise of those methods possessing an uncertainty of less than 2%.
But the incompatibility of the two methods with one another, as their results disagree at more than 5-σ significance with each other, represents one of modern cosmology’s biggest puzzles today.
 A compilation of distance ladder measurements of H0 in comparison to the Pantheon+SH0ES, where the third rung of the distance ladder is redone using various techniques. The legend shows the different techniques included in constructing this figure. For comparison, the “early relic” methods of CMB and BAO yield a value of 67 km/s/Mpc, inconsistent with distance ladder measurements.
Credit: D. Scolnic et al., RNAAS submitted/arXiv:2412.08449, 2024
A compilation of distance ladder measurements of H0 in comparison to the Pantheon+SH0ES, where the third rung of the distance ladder is redone using various techniques. The legend shows the different techniques included in constructing this figure. For comparison, the “early relic” methods of CMB and BAO yield a value of 67 km/s/Mpc, inconsistent with distance ladder measurements.
Credit: D. Scolnic et al., RNAAS submitted/arXiv:2412.08449, 2024
There are a great many ways that people attempt to resolve this puzzle: the Hubble tension. Some assert that the uncertainties within the distance ladder method are greater than are generally claimed, but those uncertainties have all been reanalyzed and are found to be well-quantified. Similarly, you can’t easily assault the CMB or the large-scale structure data, as various different collaborations and instruments all reach the same conclusion from vastly different data sets.
You can try altering the ingredients of the Universe to explain the tension, such as by introducing a new species of energy or by allowing dark energy to evolve, but the data supporting this interpretation is ambiguous. You could add in spatial curvature, change the amount of radiation in the early Universe, allow dark energy to decay, or admit an interaction (or allow a transformation) between dark matter and neutrinos. Any of these could explain why one method yields a low value from early times and the other method returns a high value at later times.
But there are a great many claims out there that one of these alternative, “third way” methods, such as
- gravitational lensing of quasars,
- gravitational lensing of supernovae,
- or standard sirens,
could resolve the Hubble tension by showing “which group is right and which group is wrong.” Unfortunately, that’s not how any of this works.
 This eight-panel chart shows an illustration of image modeling for two different lensed systems: DES 0408 (top) and HE 0435 (bottom). The observations and the lens model (1st and 2nd columns) appear identical, with the 4th column showing the reconstructed source’s mass distribution and the 3rd column showing the difference between the observations and the reconstructed model.
Credit: S. Birrer et al., Space Science Reviews, 2024
This eight-panel chart shows an illustration of image modeling for two different lensed systems: DES 0408 (top) and HE 0435 (bottom). The observations and the lens model (1st and 2nd columns) appear identical, with the 4th column showing the reconstructed source’s mass distribution and the 3rd column showing the difference between the observations and the reconstructed model.
Credit: S. Birrer et al., Space Science Reviews, 2024
To be certain, we absolutely do want as many tests of the expanding Universe — and as many ways to independently measure the cosmic expansion rate — as possible. These three other methods, two of which leverage gravitational lensing, are extremely powerful probes of the Universe, and even with small data sets, have the capability of imposing rather stringent constraints on what the expansion rate actually is.
For example, for lensed quasar systems, what typically happens is we have one large foreground mass, usually (but not always) a galaxy cluster, that bends and distorts the spacetime around it, acting as a “lens” that focuses the light from objects in the background. If there happens to be a very interesting object in the background, such as a quasar, then it’s possible for multiple images of that same quasar to appear in various locations, where each image corresponds to a light-path that the bent light from the quasar would travel along and still arrive at the same location: in our instruments, telescopes, and eyes here on Earth.
The reason this becomes a powerful probe of the Universe is that the light from the quasar, because it takes different paths to get to our eyes for each image, and because those paths don’t represent a straight line since they’re traveling through curved space, takes different amounts of time to travel from the source to the observer dependent on which light-path we look at.
 This grid, showing 80 independent multiply-lensed and/or binary quasars, showcases the power of large surveys, like DESI here, for revealing large numbers of multiply-lensed quasar systems. Over 400 such candidate systems have been identified by DESI alone, with the Vera C. Rubin Observatory expected to far surpass that number.
Credit: C. Dawes et al., Astrophysical Journal Supplement Series, 2023
This grid, showing 80 independent multiply-lensed and/or binary quasars, showcases the power of large surveys, like DESI here, for revealing large numbers of multiply-lensed quasar systems. Over 400 such candidate systems have been identified by DESI alone, with the Vera C. Rubin Observatory expected to far surpass that number.
Credit: C. Dawes et al., Astrophysical Journal Supplement Series, 2023
A similar situation arises from lensed supernovae, where the light from a single supernova in a distant galaxy — potentially even a member of the vaunted type Ia supernova class — can appear along multiple different light-paths, where the “fastest” paths see their light arrive hours, days, or even weeks or months earlier than the “slowest” paths that the light traverses. Just by watching a single astronomical object at great distances, albeit an object whose observable properties change over time, we can observe when those changes arrive for each image of the same object along those different light-paths.
That light doesn’t just arrive after journeying through the Universe, however; it’s also affected by the expansion of the Universe. If the light takes a journey of millions or billions of years to traverse the cosmic distances separating the source from the observer (along the specific light-path that it takes), the light won’t simply arrive with the same properties as it was emitted with. Instead, it will:
- be emitted with a certain wavelength,
- then experience that wavelength stretching as it travels through the expanding Universe,
- before finally arriving at our eyes (or into our instruments),
enabling us to measure the “stretch factor” of the light, which we observe as a redshift, or the multiplicative factor of its lengthening.
 This illustration shows several different light-paths from the same object, the background quadruply-lensed quasar HE0435-1223. Because the light-paths are different lengths, the arrival time corresponding to quasar brightening or faintening episodes will differ across the multiple images. Measuring the time delays and reconstructing the lensing effect allow one to measure an absolute scale in the cosmos, leading to a measurement of the expansion rate.
Credit: Martin Millon, Wong et al., MNRAS, 2017
This illustration shows several different light-paths from the same object, the background quadruply-lensed quasar HE0435-1223. Because the light-paths are different lengths, the arrival time corresponding to quasar brightening or faintening episodes will differ across the multiple images. Measuring the time delays and reconstructing the lensing effect allow one to measure an absolute scale in the cosmos, leading to a measurement of the expansion rate.
Credit: Martin Millon, Wong et al., MNRAS, 2017
When a quasar brightens or dims — or a supernova goes off and brightens, peaks, and then fades away — the delay in those features between those different (multiple) images, allow us to determine what the length of those various light-paths are, assuming there’s more than one. Normally, you need some second piece of information to calculate an expansion rate, like and absolute measurement of the “distance to the object,” such as through the brightness of a source inside of it or a knowledge of its absolute physical size.
In the case of a gravitational lens, however, all we have to do is take good enough measurements of:
- the foreground object doing the lensing, including the stars and galaxies within it,
- the background objects, whose light is bent/distorted by the foreground lens,
- and to use that information to construct a “mass map” of the foreground object,
which will show how the mass is distributed across the interior of the lensing objects, which in turn determines how the light from background objects bends. Data from space telescopes, like Hubble and JWST, is ideal for such an endeavor, and has already paid dividends: in allowing us to make a novel, independent set of estimates for the expansion rate of the Universe. We refer to this general technique as time-delay cosmography.
 This Hubble telescope image shows the locations of the first four images (S1–S4) of a lensed supernova seen in late 2014. A full 376 days later, astronomers detected a fifth image at the point SX. By using the time-delay information and the stretching of the light inferred by the time it’s arrived at our eyes, we can estimate the cosmic expansion rate. As we collect greater numbers of multiply-lensed supernovae, this could become a key method for measuring the cosmic expansion rate.
Credit: P. L. Kelly et al., Science, 2023
This Hubble telescope image shows the locations of the first four images (S1–S4) of a lensed supernova seen in late 2014. A full 376 days later, astronomers detected a fifth image at the point SX. By using the time-delay information and the stretching of the light inferred by the time it’s arrived at our eyes, we can estimate the cosmic expansion rate. As we collect greater numbers of multiply-lensed supernovae, this could become a key method for measuring the cosmic expansion rate.
Credit: P. L. Kelly et al., Science, 2023
In 2023, supernova Refsdal, which occurred back in 2014 across four separate images, was analyzed along with the observed reappearance of that same supernova in late 2015 in a fifth image. This very long time delay, of 376 days, helped provide the first estimate of the expansion rate of the Universe from this new method, of about 67 km/s/Mpc, albeit with a large uncertainty of around 5-7%.
From multiply lensed quasars, meanwhile, we’ve now discovered eight independent multiply-lensed quasar systems, with an additional 11 other (non-time delay) lenses to help with calibration issues. This has enabled an even better measure of the expansion rate: 71.6 km/s/Mpc, with an uncertainty of just 4.6%. With more gravitational lenses, including more quasars and more supernovae as background objects, this precision is expected to improve, approaching the 1-2% level over the next few years.
Finally, there are “standard sirens,” which is what we call inspiraling and merging neutron stars that leave an observable remnant behind: something we observed in 2017 for the first time, but perhaps unluckily, never since. We arrived at a value of around 70 km/s/Mpc for the expansion rate from that method, but the errors have remained large as we still only have the one suitable example.
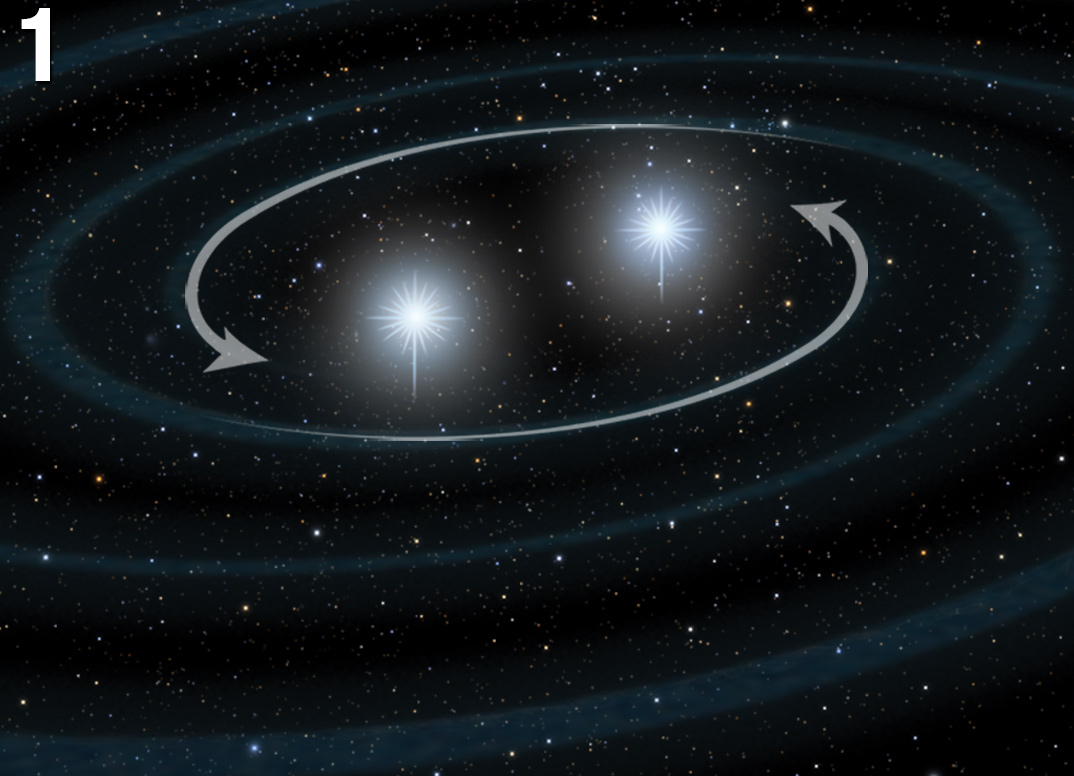 A major event for multi-messenger astronomy occurred in 2017, when two neutron stars that were extremely close inspiraled and merged, creating a kilonova and leading to the detection of an afterglow in electromagnetic radiation. If we can precisely know the host galaxy’s distance, we can use the timing data from the gravitational waves to calculate the Universe’s expansion rate. Although we’ve detected kilonovae events in both gravitational waves and electromagnetic radiation before, it’s only happened once: in that famous 2017 event.
Credit: NASA, ESA, and A. Feild (STScI)
However, it’s fair to ask: are any of these methods actually providing a truly independent measure of the Universe’s expansion rate? Or are they subject to the same biases, priors, and assumptions that would affect either the “distance ladder” or “early relic” methods? Let’s think about what those two methods are and how they work, and then let’s see how the multiply lensed quasars, multiply lensed supernovae, or standard sirens compare.
- For the distance ladder, we start here and work our way back, seeing how the Universe has expanded over the time period from when the most distant object that’s part of our distance ladder was emitted until today, when the light is arriving now.
- For the early relic method, we start from a signal imprinted very early on in cosmic history: close to the earliest stages of the hot Big Bang itself. Then we see how those signals have evolved over time, up to and including today, when the light arrives and we see what the Universe has delivered.
As you might be able to infer, all of these “third way” methods of measuring the expansion rate of the Universe suffer from the same inherent problem as the distance ladder methods: they all start only a finite fraction of cosmic history back in time, and give us a window into how the Universe has expanded from that moment up until today, when we observe that light.
 This densely populated region of space is focused on galaxy cluster SDSS J1004+4112, and showcases several objects that appear multiply imaged owing to gravitational lensing. Once called a “five star” lens, the star-like appearances seen near the cluster’s center are actually the same quasar imaged five times in the same field-of-view: a deceptive trick of light and gravity. The better we map out the foreground mass distribution, the more accurately we can infer the expansion rate of the Universe from this and other, similar multiply-lensed systems.
Credit: ESA, NASA, K. Sharon (Tel Aviv University) and E. Ofek (Caltech)
In other words, the expectation shouldn’t be that these so-called “independent” measurements will resolve the Hubble tension; the expectation is that these measurements should agree with the distance ladder value of the expansion rate. Within the errors and uncertainties, this is true for all three of:
- multiply-lensed quasars,
- multiply-lensed supernovae,
- and standard sirens,
with multiply lensed supernovae showing the most suggestive disagreement among the three. (But still, at that, only at around an unremarkable 2-σ significance.) These methods might teach us something profound about the expanding Universe, but with all we’ve learned already, they only have the power to either confirm what we already suspected (by agreeing with the distance ladder methods) or to surprise us by unexpectedly pointing to a value inconsistent with 73 km/s/Mpc.
Still, we know that there are enormous numbers of multiply-lensed systems out there, with hundreds having already been discovered, and it’s only a matter of time before we have large, high-quality data sets that can get down to uncertainties as low as ~1% for values of the rate that the Universe is expanding today. As we collect better data for the lenses themselves, and continue to construct improved mass maps for the systems, then observing either a supernova or quasar variation in the background, lensed object will lead to a better understanding of cosmic expansion. While these observations may not provide a meaningful clue towards resolving the Hubble tension, they do provide an independent cross-check of our expectations, and have the potential to surprise us by pointing in a direction that’s counter to what we anticipate. In many ways, that’s everything we could hope for by examining the Universe in a wholly new fashion.
Tags Space & Astrophysics In this article Space & Astrophysics Sign up for the Starts With a Bang newsletter Travel the universe with Dr. Ethan Siegel as he answers the biggest questions of all. Subscribe